Tuesday, September 1, 2009


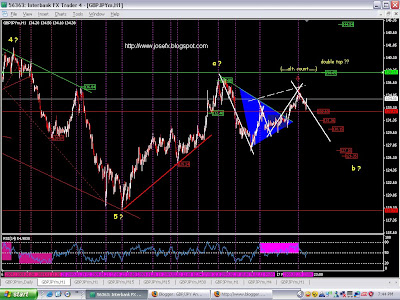
comment: as per above counting....

Wednesday, August 19, 2009

Wednesday, June 17, 2009


RSI H1 < line 50 ..................sell strong
MAE 42 > MAE 14 in H4 .......sell set up
MACD indicates strongly the downtrend pattern .........the supportive trend.

the price is expected to hit the next TP @ 154.530 after the minor retracement of the subwave completion. If this trend getting stronger the next expansion of wave will hit 150.822(fibo.-23.6), while the new wave ocunting will be re-established.

Alt.count: Or else if the moving average lines
(i.e MAE 14 > MAE42) in H1, carefull for any trend reversal pattern.

Monday, May 4, 2009

Wednesday, April 8, 2009


comment:pref. counting is as per the above draft. Any violation of this counting will establish new wave counting.

Monday, April 6, 2009


comment: Looks like it hit the double top area....this fenomena is sometimes called "the bullish trap".carefull for any bearish divergence set up....the pattern is almost completed.

Thursday, April 2, 2009


comment: its been a month i never updated this blog. Anyway, for this april...let me start with my new counting of this pound/yen performance. Previous high is 145.13 @ 24th march, whereby this is the top point of the wave. Its then has fallen touch 135.85, approximately 1000pips movements. Well, currently as we can see over the graph, price has cut 61.8% (retrace fibo), next target would be 100% retracement to make double top point!!otherwise, price might falls completing the subwave in a wave.

Monday, March 9, 2009


comment: AS per chart.Gud luck....:-)

Friday, March 6, 2009


comment: Before the market rest for the week, let us just see what market past performance has been created through the graph scratches. It is a bit hard to recognise the real divergence pattern which has been expected this week. The trial was three times. Another counting deviation is the double top point which made last thursday.Really cant recognised this pattern earlier. Anyway, market is so volatile, 100% cant be predicted accurately.Happy Weekends:-)

Tuesday, March 3, 2009


Comment: its been 3days after the bearish divergence succesfully completed last thursday. Target of this new trend is as per chart.Anyway, nothing else to confirm by right now, but im still holding my sell position since 140.88 the other day.huh..huh....

Thursday, February 26, 2009


Comment:Finally....huh...the divergence completed succesfully......ive been waiting for this validity since price @ 137...but GJ....huh..huh.....target&counting of the day is as per the above chart.

Wednesday, February 25, 2009


comment:I see completion of bearish divergence.Prepare the weapon!lets blow the top to the bottom!!!

Tuesday, February 24, 2009


Comment: As per chart....careful..for any reversal pattern.I see no valid divergence over the pick point yesterday.hehehe...ergh...

Monday, February 23, 2009


comment: I have established a new counting.Previous divergence was invalid according to current market performance.


comment: market is move as per counting....

Friday, February 20, 2009


Comment: Hehm..for the moment, it is really hard to determine how strong this bearish trend movement after the divergence.In 15mnts TF, MAE 14 is above MAE 42 indicating bullish.While in my main indication, TF H1, the moving averages interception is indicating the trend (bear, while the smac-d indicates the opposite.Well, of course my preferred counting as per the chart.Anyway, market is uncertain and we cant never determined the market movement, but what is indicated is what happen.Happy weekend!Happy trading!

ദിവേര്‍ഗെന്‍സ്


Comment: Preferred counting as per the chart.

Thursday, February 19, 2009


Comment: I never experienced this type of bearish divergence pattern.But, i believe that this is a major divergence to end this bullish trend.The only alternative count is, maybe this pattern hasnt completely finish.My strong prediction is price will fall to 130.25 or 128.12 in expansion. Please refer to my chart to see the alt. count for this pattern.


Comment: Target profit 1 has been hit.Next target will be 137.41.

Wednesday, February 18, 2009

Monday, February 16, 2009


Comment: I believe the main market trend is still bullish since i dont see any indication or pattern of trend reversal yet. Frankly, ive closed all my buy posts.I have entered new buy post. with target 132.43 or 133.66 in expansion.

Friday, February 13, 2009


Comment: Opss...i almost didnt realise this pattern.Its a bullish divergence...therefore..im counting a new pref. counting.Examine yourself through my charts above.Good luck!!!p/s i missed my chance closing 1100pips yesterday.When i open my account this morning..its only 540pips left to be closed..huhuhuhu (unlucky me cant online 24/7.Besides ive forgotten t0 lock +750pips SL.what a pity).


Comment: AS expected.Target buy since started is 130.76 or 131.92 in expansion.Carefull for any major bearish continuation.Good luck!!!

Wednesday, February 11, 2009


Comment: yeah!!almost 600pips there!..congrats to those made it!!hehehe...after a great bearish divergence completed..next target is 127.42 or perhaps 124.45 in expansion.but carefull for any minor reversal....i.e. subwave in a wave.

Monday, February 9, 2009


comment: Im posting an alt. count due to the current market performance.What is exactly the market performing?well, let just see what the indicators say. Currently, RSI is above line 50, while moving average lines in 15mnts timeframe, MAE 14 > MAE 42. In my opinion., if the market cut bearish critical line @ 137.38, there is further expansion of divergence line. Target 139.45 or 141.62 in expansion.


Comment: What we just saw is minor bearish divergence. Usually there will be two incidents that might happen.First, market perhaps performing sideways before ended with bearish trend, and second market perhaps straight away performing downtrend as the impact of bearish divergence. So for those holding positions, carefull for any reversal pattern, or minor bullish pattern. If im expecting, market perhaps will go down to 130.32 retrace 38.2% fibo. retracement, or 128.04 in expansion.

Wednesday, February 4, 2009


Comment: i believe market still performing major bullish trend.I dont see any indication of reversal pattern.i.e any divergence to end this bullish trend.Wait for any good set up to enter buy into the market again.Those who still hold buy post, good decision.so be careful for any changes in the trend..perhaps...since for the moment i dont see any good set up yet to buy again!As per the picture, my preffered counting is bullish with the target132.63 for the day..or 137 in expansion.

Friday, January 16, 2009


Comment: Target of buy position is 136.84 or 137.31 in expansion. Be carefull of any reversal pattern or indication.

Wednesday, January 14, 2009


Comment: If im not mistaken, what ive seen through out yesterday performance is a "bullish divergence". From the trend analyst, the RSI is about to cut line 50 and supported by the moving average lines which is almost intercepted each others. What else to wait for is buy entry. Target will be 132.73 or 134.09 in expansion. The wave target is @ 136.04 (fibo 61.8%).Smac-d in 30mnts tf, (trend analyst) is clearly indicates bullish trend.

Monday, January 12, 2009


Pref.Count: Currently, im waiting for any sign of bullish entry.IF today's price falls and hit 134.36,there should be bullish divergence pattern created. Target of buy post is 137.73 or 138.13 in expansion.

Alt count: Bearish hit 134.36.

Comment: Market of the day, smac-d in 30mnts shows bullish indication, but hasnt supported by other indicators. RSI < line50, MAE 42 > MAE 14.

Tuesday, January 6, 2009


Analysis: Through out yesterday performance, the moving average lines are opened widely, indicate how strong the bullish trend yesterday.Normally, after such impact the trend might turn the opposite to make the moving average lines cross each others again (bearish start up).The smac-d indicates bearish pattern, while this trend is supported by the RSI which is almost intercept line 50.What exactly im waiting for is the confirmation from these indicators to support this bearish trend.

Pref.Count: Im expecting the price today fall 133.66 or 131.35 in expansion. If the RSI intercept line 50 successfully, while supported by the moving averages interception, we are BINGO.

Alt Count:Otherwise, we might see further uptrend with the target on wave counting @ 141.24 (fibo 261.8).

Monday, January 5, 2009


Pref.Count: At this moment of time, Im waiting for bullish trend, expecting price to touch 135.43 or 137.48 in expansion. Any further bearish trend perhaps wave 5 in expansion in progress again as i dont see any clear divergence to end this major trend.

Comment: From the trend analysis in 30mnts tf, as we can see the moving average lines cross each others (MAE 14>MAE 42) indicate bullish trend.Because the smac-d pattern indicates the other side (which is strong bearish indication), im waiting for any confirmation from either the stochs or smac-d to turn into bullish indication. RSI is above line 50 for the moment, while the analyzer; 65% ups, 35% down.

Friday, January 2, 2009


1.t-set up: 62% bullish, MAE 14> MAE 42, RSI > 50, (BULLISH.

2. White-completion: sell set up

3.(3/4) TF Analysis:

(sell set up)
5m-1111 (4/4)
15mnt-1111 (4/4)
30m-0111 (3/4)
h1-0110 (2/4)
h4-0000 (0/4)

10:10 AM 02/01/2009


Comment: Above chart, i can say that bullish is still strong as the moving average intercept just right indicating bullish trend.Also supported by the Smac-d pattern. Target will be 135.36 or 137.11 in expand, expecting subwave 1 "in wave a". Any bearish trend possibly would be wave 5 in expansion or subwave 2 of "wave a" in progress.