"There is only one side of the market and it is not the bull side or the bear side, but the right side."
Wednesday, December 1, 2010
Its 1st of December
Comment: When the day entered December, Christmas is just around the corner...it should be a great season for me & of course others. Hopefully pips awarded for us before the Christmas day.hopefully...
Well, about today analysis;
RSI - 25 > RSI (oversold). Effect the market directly bouncing up for
about 50++ pips yesterday.
Smac-D - Being above line zero (no turning point confirmation) yet if smac-d
make a pattern, then that bullish divergence could be valid.
Overall, my indicators didn't make any clear signal to buy. I could only find Not clear (NC) Signal though.Anyway, i'm just waiting for a right signal to enter the market. Whose have been in a market (buy), go ahead ..try to find false signal that against our target.If there's any false signal...get your butt out of it immediately..Minimize risk, maximize profit!!
Tuesday, November 30, 2010
GBPJPY, morning 30 Nov 2010
comment: Not much to comment on. As the RSI is always being inbetween line50, i believe market is finding corrective wave.as if you still holding your sell position, consider to close some of them, as you might facing the moment where market is like playing on you..its only my theory based on above chart performance.
Friday, November 26, 2010
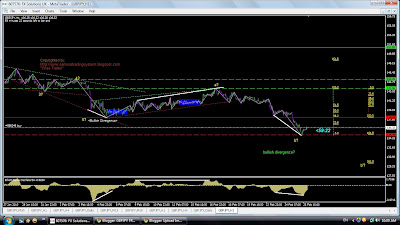
The minor bullish divergence
comment: Well today i just noticed that that minor bullish divergence (double bottom point) really made an impact. If we could see the RSI, it is persistent being on line 50 (sideways effect). It could be market performing minor retracement or major turning point, but preferebly minor retracement so that wave could continue down to complete the indication @ daily timeframe. (where smac-d is about to perform turning point).thru out the day, there isnt any overbought situation yet RSI persistent making sideways signal.Good signs for bearish side.
Wednesday, November 24, 2010
comment: it is a bit tricky this time when i was about to find the real top point. There are just too many false signal, bullish trap and other impacts pattern. Especially this type of divergence,it is really almost deviates it's nature when the pattern getting longer. Relief, its the RSI that confirm the turning point.
Anyway, im expecting price will getting down, target at least hit 130.33 @ fibo. retracement 61.8%.
Tuesday, September 21, 2010
Monday, September 13, 2010
which trend is major?
Comment: i've been waiting for any indication that bias to bearish trend but i didnt found any perfect signal. Was that last divergence that i found end up with major trend turning point or it just minor bullish trend that currently progressing. Anyway, lets talk about the indicators in H1,RSI is stable moving in between top & bottom line, there is no "overbought"', while smac-d both signal line & the histogram being above zero line
and this trend is strongly supported by the MAE 14 line which price is still moving above the MAE line.However, if there is sell set up happen in M15, it could test this resistance line to break this top point.
Thursday, September 9, 2010
bullish or....retracement..???
comment: at the moment i believe market is performing minor retracement, and this could be valid until price test the resistance at 127.87. im predicting price should go further to at least hit 23.6 fibo to confirm the major bullish trend.at H1 timeframe, RSI line hit line 20, while smac-d (15M); signal line is above the histogram and both being above zero line indicating short term bullish turning point. this bullish trend can be confirmed if smac-d at H1 timeframe supporting the trend which can be identified only if the turn over point shown.anyway market is a bit volatile as everyone realise it.
Wednesday, September 8, 2010
8s ept 2010
comment: price has cut below ext. fibo 61.8, where the end bottom point produce the image of bullish divergence. There could be 2 scenarios that i can come with analysis for today. Its either, market is doing minor retracement as the big timeframe indicates strong bearish trend,or market is starting up to reverse the pattern. If i count the wave, market is now performing minor wave 4 and going to complete wave 5 in a favour of downtrend, while if the wave that we're talking about is a corrective wave, then we have completed wave c, where market predicted to make reversal. stick to your target, careful with the indication, and try to get supportive indicators to confirm this situation.
Monday, September 6, 2010
6 sept 2010
comment: Hi im back. Ive left trading since may 2010, and its been like im loosing a lot of trading opportunities..turnover for GBPJPY is like 1000pips month-to-month.
anyway, while waiting for my deposit be bank into my trading account, i have my analysis on gbpjpy as per my wave counting to post.
In recent performance, i believe market has produced major bullish divergence, that can be seen over the double bottom point. as market is currently progressing bullish, it is not a good time to buy again. Let just wait until the market falls in oversold area, then re-confirm the situation through the indicators.
most traders i can say; they all might have been waiting for the price to hit ext. fibo 61.8 (to get a real LL bottom point.
Wednesday, March 24, 2010
Comment: right at this moment it is not really a good time to enter the market. I expect wave going to perform minor triangle pattern before market goes down again. It is a major downtrend. Fundamentally, i believe yen will not overbought by this week. lets expect something big happen right on monday.
Monday, March 22, 2010
Comment: Yen has been oversold out of BOJ operation. I have closed some of my short position, expecting bullish set up, as i believe sooner or later yen is getting expensive. According to my counting, wave B is completed, and we are going for wave C, whether truncated C or some longterm wave performance.
Thursday, March 18, 2010
Tuesday, March 16, 2010
Sunday, March 14, 2010
Friday, March 12, 2010
comment: i see that imperfect bearish divergnce yesterday. i even get tricked by that trend dance...huh...few pips gone like that. anyway, i believe market is performing uptrend making double top so that bearish divergence is just perfect for sell set up.
i learnt something over yesterday market....that bearish trap is just make me sick...
huh...huh...
Thursday, March 11, 2010
Tuesday, March 9, 2010
comment: i was too late to enter into the market last night..thats was around 1.00 am here in malaysia when the indicators given out clear signal to sell...huh...
but its ok..just catch whatever i can thru this downtrend...huh...
just be careful with this 5 stars impact of gbp trade balance which predicted to come out -7000. last time was -7120.
Monday, March 8, 2010
Saturday, March 6, 2010
comment: as what ive waited. For the moment, above counting is valid.i have full reason for that. And here are the strength analysis for yen;
gbpjpy,
(sell)
15mnt-1111
30mnt-0001
h1-0000
h4-0000
d1-0110 (smac-d pattrn)
gbpusd,
(sell)
15mnt-0111
30mnt-0010
h1-0000
h4-0000
d1-0100
usdjpy
(sell)
15mnt-1111
30mnt-1111
h1-0100
h4-0000
d1-0111
summ; jpy > gbp
usd > gbp
usd > gbp
hence; usd > jpy > gbp
then; jpy > gbp (moderately)
Friday, March 5, 2010
Indicators analysis
5 march 2010, malaysia 850am.
gbpjpy,830am
(sell)
15mnt-1001
30mnt-0001
h1-0001
h4-0000
gbpusd,830am
(sell)
15mnt-1000
30mnt-1100
h1-1111
h4-1100
usdjpy,830am
(sell)
15mnt-0001
30mnt0000
h1-0000
h4-0000
audusd,845am
(sell)
15mnt-0000
30mnt-0000
h1-1110
h4-0111
audjpy,845am
(sell)
15mnt-0000
30mnt-0000
h1-0000
h4-1001
summ; jpy > gbp
usd > gbp
jpy > usd
usd > aud
jpy > aud
hence; jpy > usd > gbp = aud
then; jpy > gbp (bearish is strong)
......................................................
comment: above was my indicators performance. it seems like jpy is much more stronger than the others...spesifically jpy is much more stronger than gbp. so i believe that this bullish trend @ least hit fibo 50.0.
Happy trading :-)
Thursday, March 4, 2010
comment: this is what ive been waiting for..ive been waited since last night this impact...i now realise the weaknesses of these indicators. anyway, i hope that this trend gonna be a major trend to perform new wave as per above counting. Otherwise...its gonna bear again as the big time frame havent indicates bull pattern yet...
huh...what a market..
comment: sideways effect..its a boring mode..have waited for the impacts of that imperfect bullish divergence. i have being into the market since yesterday morning because of seeing false signal. and it is really moving to side like a crab making his way...huh...some people may have panic with this market condition...well you know +,- ..if enter sell..indicator may indicate buy again..then you close your position...entering buy..in few hours its sell indication again...then you once again close that long..and short once again...well if you are in this condition...i suggest that you should resting...wait for this sideways impact finish totally.
Monday, March 1, 2010
comment: well, there is perfect bullish divergence created over the great impact of bearish trend. there are 3 probabilities, whether that divergence is fully completed or doing some more extension.i.e. another downtrend. 2nd possibilities is that divergence is perfect to end this bearish trend and we are about to look out for any bullish set up. 3rd possibility is that divergence is false, because there can be any chances market will erase that divergence pattern when market is going down again, which mean wave b is never be completed yet. Whatever it is, i am waiting for good signal to catch this bullish trending. Buy!!!buy!!!...no more sell..huh....
Friday, February 26, 2010
comment: its a little bit complicated to comment on the market right now. I see the image of bullish divergence that usually indicates the trend has ended, but im not sure whether or not that divergence is valid or not, as the big time frame indicating bearish trend. Is the market going to "wave b''? or the market performing a new bullish wave..i entered bullish this morning...if the trend is not valid at least i score the retracement pips. Hehm.......
Wednesday, February 24, 2010
comment: ops it was my mistake when i judge the book only but its title..im was seeing the smac-D pattern of daily time frame which at earlier it was supported by the trend pattern of wave continuation..but i manage to finally catch the signal of market down. Dow Jones index is really falls below low now ( -100.97 (0.97%). Well it was great last night when i score almost 120pips per position. Now, i am waiting for the retracement & and might come into the market again when it has started to create a journey to the first point of "wave b".
Monday, February 22, 2010
Friday, February 19, 2010
Comments: Good morning. At this time i am really sure that the market is now performing new wave trend. As per my counting above, wave is now towards wave b. That imperfect divergence which we've found yesterday really has ended bullish trend. Otherwise, if that daily timeframe doesn't indicates completely bearish then we could see the market might going up.
Thursday, February 18, 2010
Comment: It is a lil bit difficult to analyze this market trend. I have to counting whether the market is performing subwave in major major wave a, or the trend has ended as i can see there is a pattern like bearish divergence produced recently. Whatever it is i have entered the market as you can see and hope this gonna a new bearish trend to make wave b in accordingly.
Tuesday, February 16, 2010
Monday, February 15, 2010
Thursday, February 11, 2010
Comment: For the moment as we notice, we couldnt see the end of this retracement as i have come out with 2 possible counting of the day. Major trend as per Daily timeframe is still downtrend, where the graph is predicted to head down again to complete major wave 5 (big wave). Careful for any entrance made whether long/short is all depends strongly on multiple timeframe. Good Luck
Wednesday, February 10, 2010
Comment: Only yesterday we finally see the impact of the great bullish divergence. For me, what i can see the market is still in it major downtrend, it just i couldnt decide how far along this bullish divergence impact could be. I am preferably like to see market performing wave b and continue with the trend. Otherwise we could see the real effect of that divergence that might end up with a new wave counting. Whatever it is, just be careful as i still dont see any good signal to play in market now
Tuesday, February 9, 2010
comment: i don't see any impact of that great divergence which visible in timeframe H1 clearly. It supposedly to retrace, before market started to falls again in its major trend. Be carefull, signal is always there, wait for any changes made in a very timeframe's indicator. Just to clarify, i am predicting that market is in major bearish trend.
Monday, February 8, 2010
GBPJPY, 3.12pm 8/02/2010
Comment: as per my prediction, market is now still in major bearish trend. if we can see any divergence from 15mnt timeframe, that would indicates that market will perform minor retracement before it continue this major bearish trend..be carefull if you would like to take opportunity in catching this retracement situation.
Monday, January 18, 2010
18 jan 2010 / 10:18pm
Subscribe to:
Posts (Atom)